

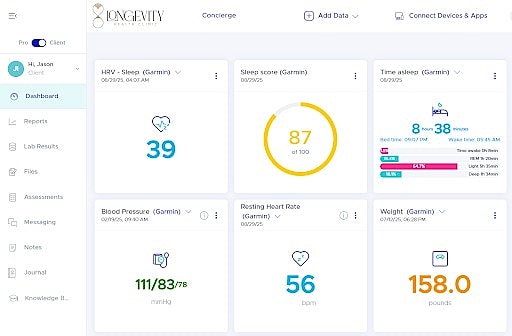
We live in a time of unprecedented access to personal health information. Wearables like Oura, Garmin, Apple Watch, and Whoop track sleep, activity, and recovery. Continuous glucose monitors (CGMs) show real-time blood sugar fluctuations. Withings scales and blood pressure monitors connect daily vitals to the cloud. Nutrition apps like Chronometer and MyFitnessPal quantify macronutrients and micronutrients with a level of detail that once required a professional dietitian. Add to this advanced testing through Labcorp, Rupa Health, and biological age assessments like TruAge, and it’s easy to see why so many patients arrive in my office with a mountain of data.
At Longevity Health Clinic, we take this even further. In addition to consumer devices, we provide resting metabolic rate (RMR) testing and 3D body composition analysis—tools that measure metabolism directly and quantify fat and muscle distribution with clinical precision.
The problem? Data without context is overwhelming. Patients often confess,
“I’ve tracked all these numbers, but I don’t know what they mean—or what to do about them.”
That’s where integration and expert interpretation make the difference. By weaving together multiple data streams, we can move from raw numbers to actionable insights that directly inform a personalized treatment plan.
Each source of data is like a single puzzle piece. Wearables, labs, and scans all capture one dimension of physiology. Alone, the pieces can be confusing—or misleading. Together, they reveal a full picture of how your body is functioning. Here’s an example:
Taken separately, none of these numbers sounds alarming. Together, they tell a clear story: unstable blood sugar, rising inflammation, disrupted recovery, unfavorable body composition, and accelerated biological aging. That’s a call to action—one we can answer with tailored interventions.
CGMs provide immediate feedback on how meals affect blood sugar, while apps like Chronometer and MyFitnessPal highlight dietary patterns over time. A Withings scale adds context for weight trends, but resting metabolic rate (RMR) testing and 3D body composition analysis allow us to determine whether nutrition is fueling metabolism properly and whether changes in weight reflect fat loss, muscle loss, or both. For example, a patient may carefully track calories but fail to lose weight because their metabolism has slowed—something only RMR testing reveals. When we add body composition analysis, we can design precise nutrition strategies that protect lean mass, restore metabolic health, and drive sustainable results.
Wearables like Garmin, Apple Watch, and Whoop capture training load, activity, and recovery, but they don’t always reveal whether workouts are producing the right adaptations. A 3D body scan closes that loop by showing whether muscle is increasing and fat is decreasing in response to training. A patient might be logging daily workouts, yet the scan reveals muscle loss and Whoop shows declining HRV—clear evidence of overtraining. By integrating these insights, we can recalibrate their exercise plan, building in resistance work, structured recovery, and tailored nutrition.
Sleep is foundational to longevity and performance. Deliverables provide nightly insights into deep and REM sleep, HRV, and recovery scores. Poor sleep often shows up in other domains—blood sugar swings, rising stress, and higher inflammatory markers. When patients commit to earlier bedtimes, reduce evening screen use, or limit alcohol, improvements appear not only in sleep data but also across labs and wearables. Here, the focus is on restoring circadian alignment and recovery, without the need for metabolic or body composition testing.
Stress is often invisible until devices make it measurable. HRV trends from Oura or Apple Watch, combined with cortisol testing, show how well the body is handling demands. A patient may feel fine but show steadily declining HRV and elevated morning cortisol, indicating that their system is under pressure. Interventions like breathwork, mindfulness, and adaptogens can restore balance and resilience.
CGMs reveal how meals, exercise, and stress affect glucose minute to minute, while labs such as fasting insulin and HbA1c show long-term patterns. Patients often present with “normal” lab values but significant glucose swings on a CGM—an early marker of metabolic dysfunction. Identifying this pattern allows us to intervene years before diabetes develops.
Lab markers like hs-CRP and IL-6 provide snapshots of systemic inflammation, while TruAge biological age testing shows how inflammation and lifestyle are accelerating—or slowing—the pace of aging. When a TruAge report reveals accelerated aging, and a 3D body scan confirms visceral fat accumulation, we know systemic inflammation is at work even before symptoms appear. Interventions might include anti-inflammatory nutrition, targeted supplementation, and addressing underlying drivers such as gut health or environmental exposures.
Blood pressure from a Withings monitor, lipid markers like ApoB, and wearable heart rate/HRV data remain central to cardiovascular prevention. But some risks are silent until measured directly. A 3D scan can uncover visceral fat around the organs even in patients with a normal BMI, offering an early red flag. When combined with labs showing elevated ApoB, this allows us to take proactive steps long before disease develops.
It’s tempting to approach health optimization as a do-it-yourself project. But raw data can mislead. A CGM spike to 140 after fruit may be normal. HRV scores are highly individual. Calorie estimates from apps are often inaccurate. RMR suppression can look like “willpower failure” when it’s actually physiology adapting to chronic stress or under-fueling. And biological age testing without context may feel discouraging rather than empowering. The value lies in integration and interpretation. As a certified IFM practitioner who uses these tools personally, I don’t just analyze the numbers—I connect them to physiology, lifestyle, and root causes. That’s how I help patients transform scattered data into a coherent narrative and, more importantly, into a treatment plan that changes outcomes.
The promise of health technology isn’t in the numbers themselves. It’s in what we do with them. At Longevity Health Clinic, our approach is simple:
That’s how we turn data overload into actionable insight—and ultimately, into better health, performance, and longevity.